Table of Contents
Learning how to read forex charts is one of the most practical skills for anyone studying currency markets. A chart is not a prediction. It is a visual record of what buyers and sellers have actually done, shown as price movement over time. When you learn how to read forex charts, you learn to see trends, turning points, and areas where price has previously reacted, rather than guessing what will happen next.
This guide explains how to read forex charts step by step, starting with candlesticks, then moving to trends, support and resistance, and common chart patterns. It uses simple examples and plain language, and it is for education only. It does not provide trading signals or guarantee any outcome.
What a forex chart shows
A forex chart plots the price of a currency pair against time. Time runs from left to right, and price runs from bottom to top. Each point on the chart represents a price at a particular moment. By connecting these points, or by drawing candles for each period, a trader can see whether price is rising, falling, or moving sideways.
Charts can use different timeframes, such as one minute, one hour, four hours, or one day. A daily chart shows one candle per day, while an hourly chart shows one candle per hour. Shorter timeframes show more detail and more noise, while longer timeframes show the broader direction more clearly. Beginners often benefit from studying daily and four-hour charts first, because the patterns are easier to see.
How to read forex charts: candlesticks explained
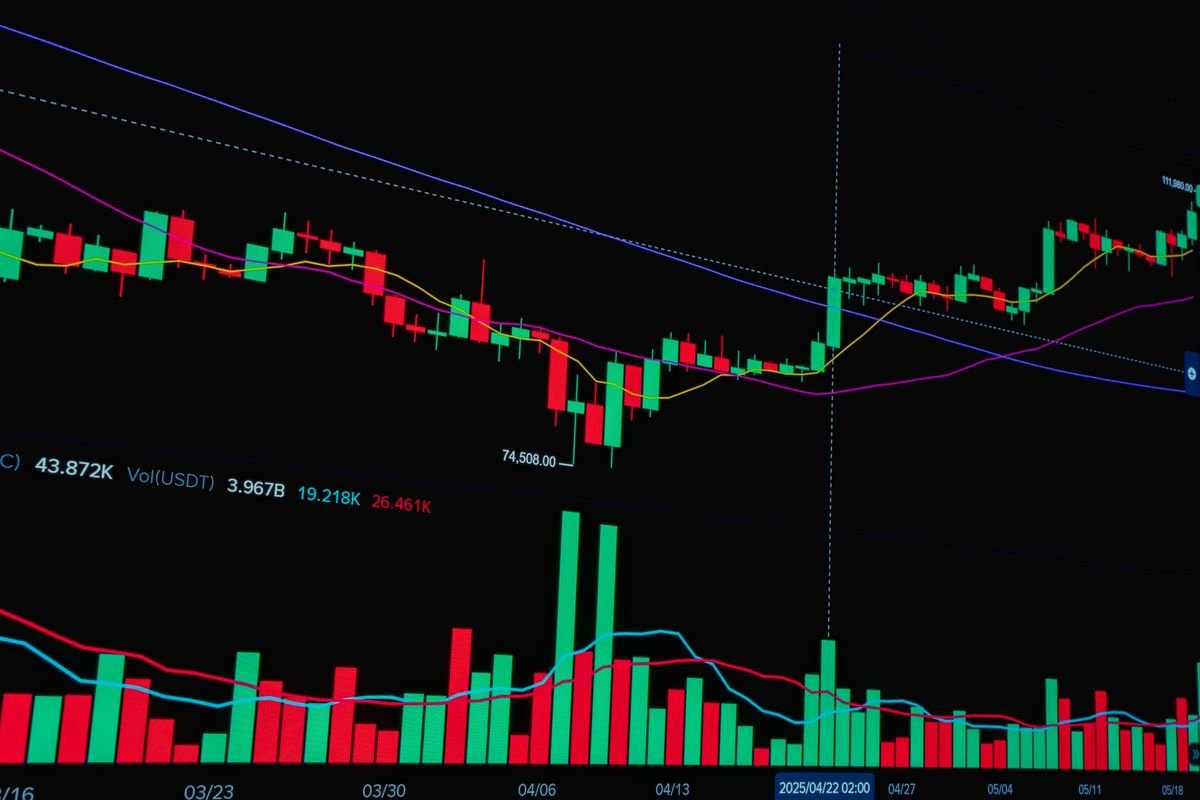
Candlestick charts are the most widely used type of forex chart. Each candle represents one period and shows four prices: the open, the high, the low, and the close. The thick part of the candle, called the body, shows the range between open and close. The thin lines above and below, called wicks or shadows, show the high and low reached during that period.
- Bullish candle: The close is higher than the open. The body is often shown in green or white, and it suggests buyers were in control during that period.
- Bearish candle: The close is lower than the open. The body is often shown in red or black, and it suggests sellers were in control.
- Long wick: Price moved far in one direction but closed back near its starting point, which can signal indecision or rejection of a level.
- Small body: Open and close were close together, which often signals balance between buyers and sellers.
One candle alone tells only a small story. The story becomes clearer when you read several candles together. For example, a series of higher highs and higher lows suggests an uptrend, while a series of lower highs and lower lows suggests a downtrend. A single large candle after a long move can signal strong momentum, but it does not guarantee continuation.
Trends: uptrend, downtrend, and sideways markets
A trend describes the general direction of price over time. In an uptrend, price makes higher highs and higher lows. In a downtrend, price makes lower highs and lower lows. In a sideways market, price moves within a range without a clear direction, bouncing between an upper and a lower boundary.
How to identify a trend simply
Start by stepping back and looking at the chart as a whole, rather than focusing on the last few candles. Ask three questions: Is price generally rising, falling, or moving sideways? Are the highs and lows getting higher or lower? Is price above or below a longer-term average, if one is shown? Answering these questions helps you describe the trend in words, which is more useful than relying on a feeling about the chart.
Support and resistance explained
Support is a price area where buying interest has previously been strong enough to slow or stop a fall. Resistance is a price area where selling interest has previously been strong enough to slow or stop a rise. These areas are not exact lines. They are zones where many traders are watching, placing orders, or remembering past price behaviour.
Support and resistance can be identified by looking for areas where price has turned several times. The more times price has respected an area, the more significant that area may be. When price breaks through a support or resistance zone and stays beyond it, that zone can sometimes change roles: old resistance can become new support, and old support can become new resistance. This is a common concept in how to read forex charts, but breakouts can also fail, so a break alone is not a reliable signal.
Common chart patterns, explained carefully
Chart patterns are shapes formed by price movement that traders study to understand market structure. A double top, for example, forms when price rises to a resistance area twice and fails to break through, which can suggest weakening upward momentum. A double bottom is the opposite pattern near support. A head and shoulders pattern consists of three peaks, with the middle peak highest, and can suggest a possible reversal, although it is never certain.
Triangles form when price ranges narrow over time, with higher lows and lower highs, or with a flat boundary on one side. Flags and pennants are short consolidations after a strong move. These patterns are useful for describing what price has done, but they should not be treated as guarantees. Many patterns fail, and a pattern on a short timeframe may look very different on a longer timeframe.
Indicators: helpful tools, not answers
Indicators are calculations based on price, such as moving averages, the Relative Strength Index, and moving average convergence divergence. A moving average smooths price over a period and can help show trend direction. The Relative Strength Index measures recent price strength and can highlight when a market has moved unusually far in one direction. Indicators can support analysis, but they are derived from past price, so they lag the market and can give conflicting signals.
A practical routine for how to read forex charts
- Start with a longer timeframe to identify the overall trend and key support and resistance zones.
- Move to a shorter timeframe only to refine your understanding of recent price behaviour.
- Mark support, resistance, and trendlines on the chart, and note where price has reacted before.
- Read candlestick patterns in context, not in isolation, and check whether they align with the trend.
- Write down your reading in one or two sentences before considering any trade, and review it later.
For example, you might write: EUR/USD is in a daily uptrend, price is approaching a previous resistance zone, and recent candles show smaller bodies, suggesting momentum is slowing. That sentence describes the chart without predicting the next move, and it gives you a clear basis to review later. This routine is also covered in related reading on this site, including What Is Forex Trading? A Beginner’s Guide to Currency Trading, the Forex Basics category, and the Risk Management category. For independent background, see the Investopedia guide to candlestick charts.
Mistakes beginners make when reading charts
Common mistakes include switching timeframes constantly, adding too many indicators until the chart is unreadable, drawing trendlines to fit a desired outcome, and treating every pattern as a signal. Another mistake is ignoring risk: a chart reading, however careful, does not remove the risk of loss. Successful learning comes from keeping charts clean, using a consistent routine, and accepting that many readings will be wrong.
Frequently asked questions about how to read forex charts
What timeframe should beginners use?
Daily and four-hour charts are often easiest for beginners, because they show clearer trends and fewer false signals than one-minute or five-minute charts. Shorter timeframes can be studied later, once the basics are comfortable.
Do candlestick patterns predict price?
No pattern predicts price with certainty. Patterns describe past behaviour and possible tendencies, but price can move against any pattern. Patterns are most useful when combined with trend, support and resistance, and risk management.
What is the difference between support and resistance?
Support is an area where price has previously stopped falling, while resistance is an area where price has previously stopped rising. Both are zones, not exact prices, and both can be broken, sometimes with a change of roles afterwards.
How many indicators should I use?
Start with none or one, such as a moving average, and learn to read price itself first. Adding indicators before understanding price often creates confusion rather than clarity.
Can I learn how to read forex charts without trading?
Yes. Studying historical charts, marking trends and levels, and writing down your readings is an excellent way to learn without risking money. A demo account, where available, can also help you practise chart reading in a live environment without real funds.
Disclaimer
Disclaimer: This article is for education only and is not financial advice. Forex trading involves a significant risk of loss, and chart analysis cannot guarantee any result. Seek independent professional advice before making financial decisions, and never trade with money you cannot afford to lose.